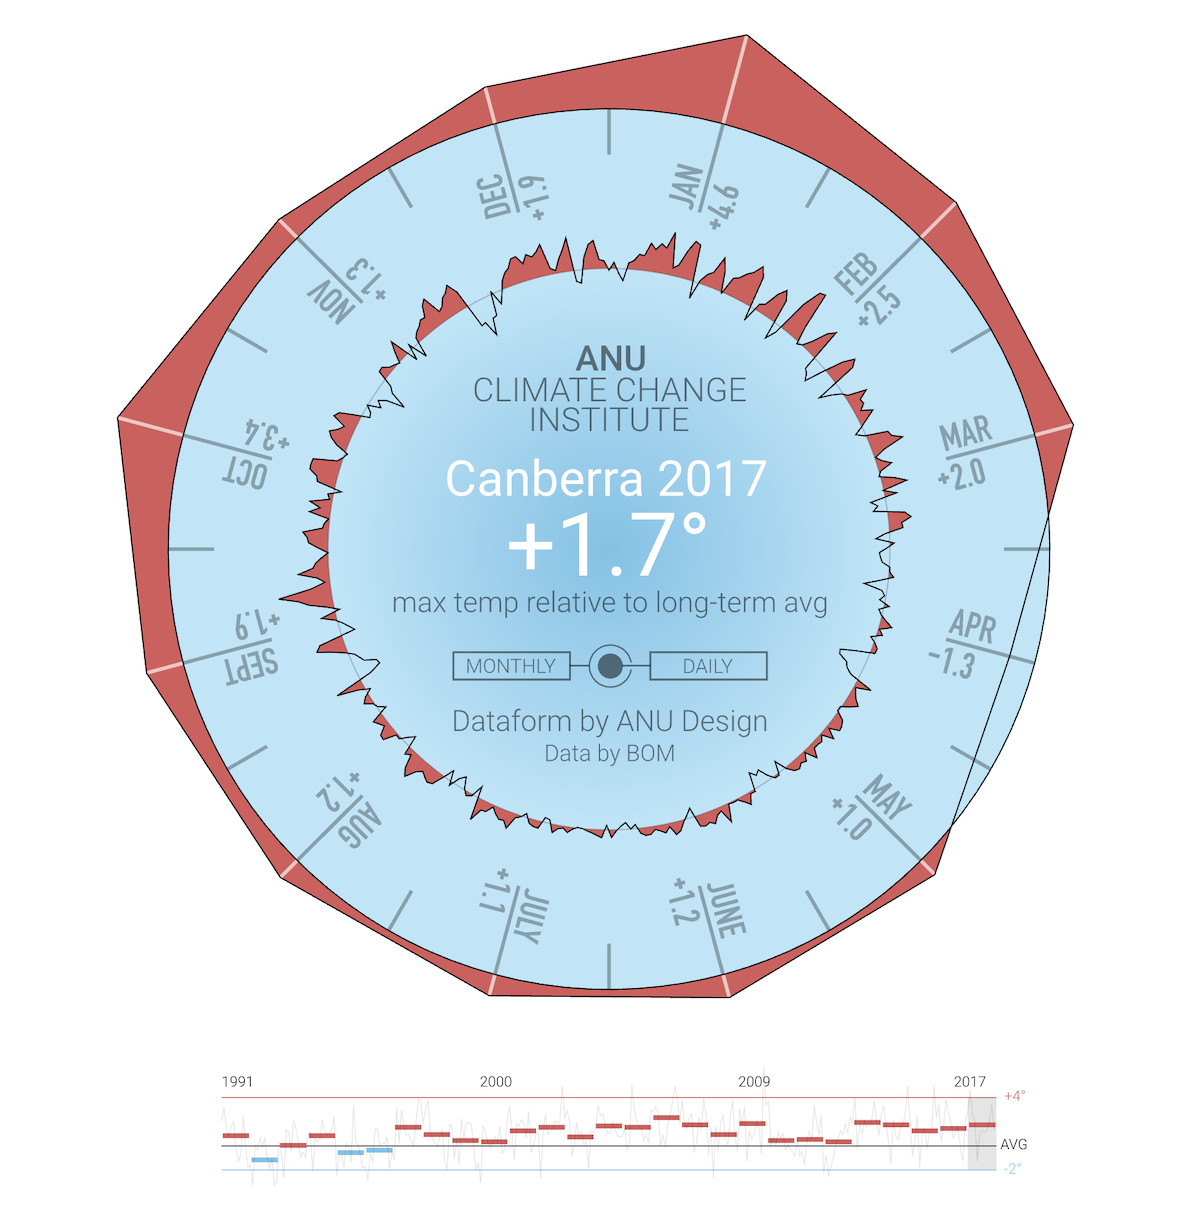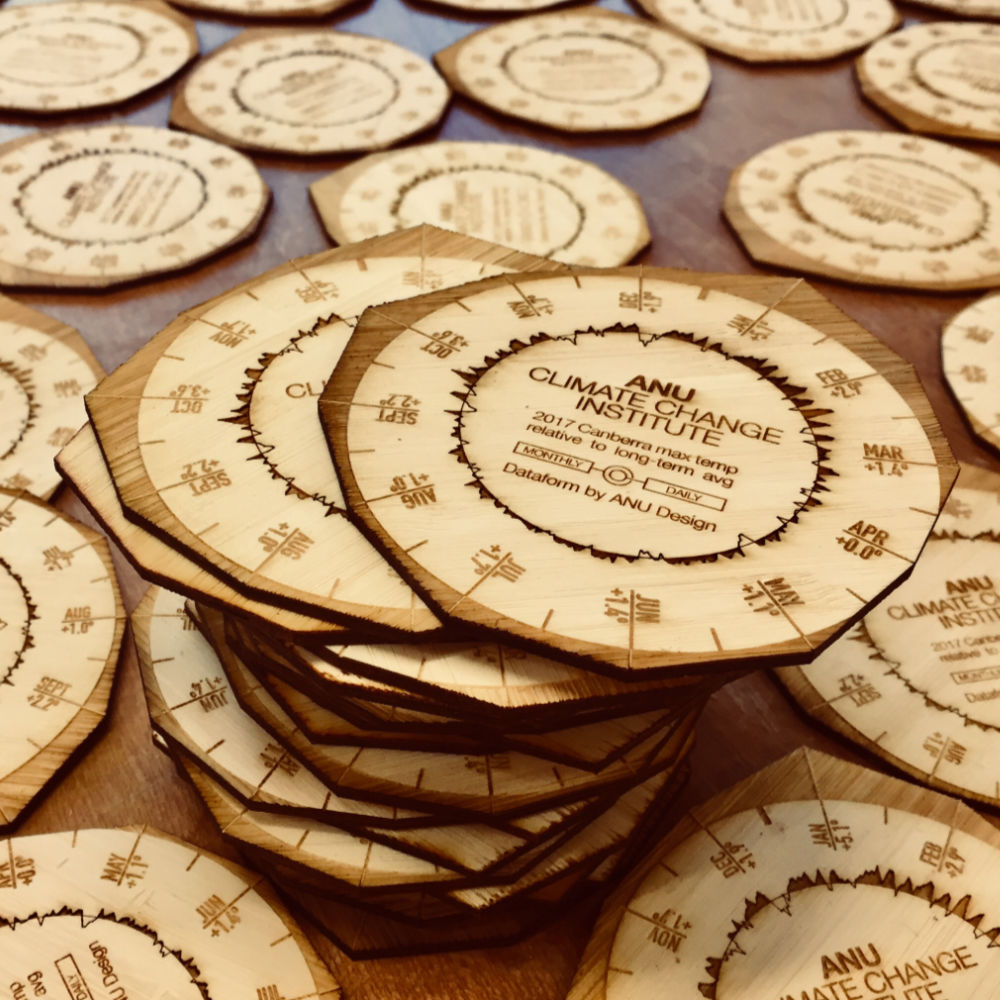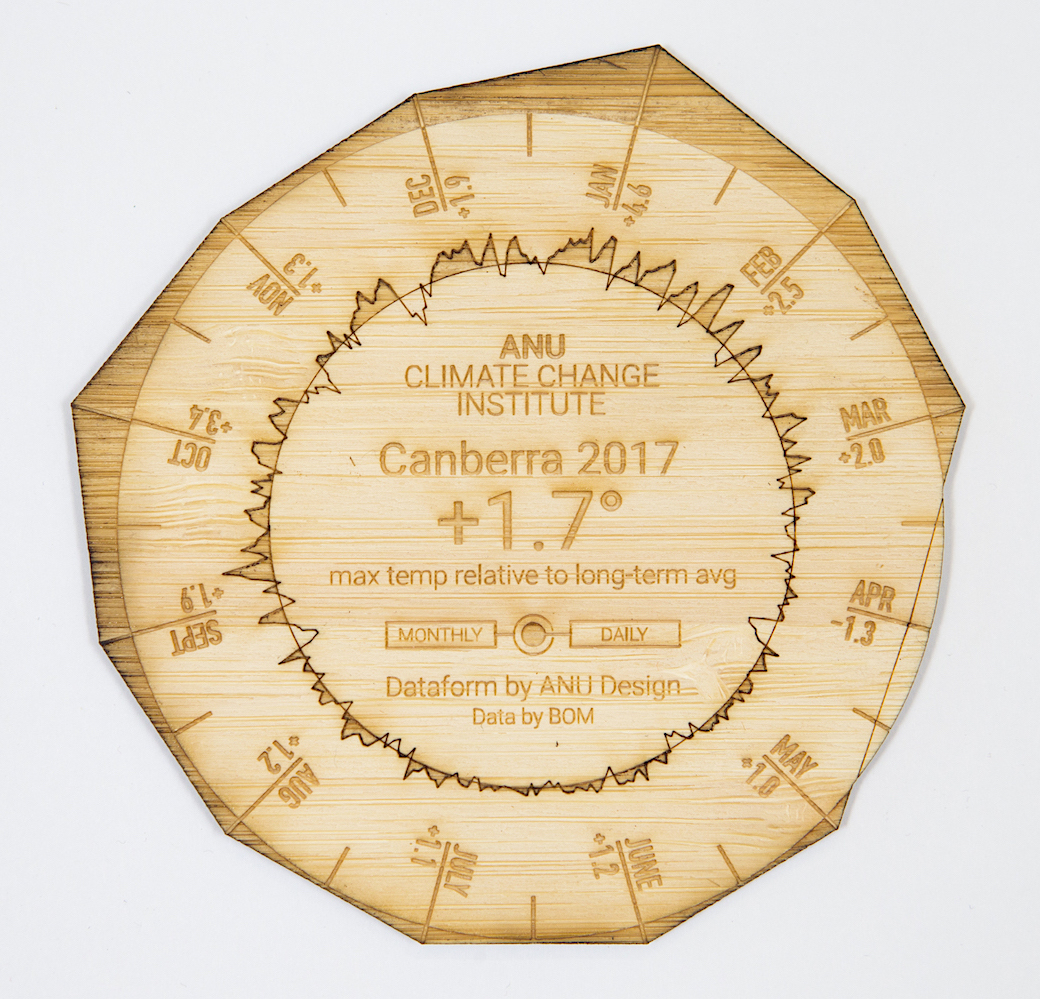
Working with the ANU Climate Change Institute, we designed a tangible visualisation showing monthly and annual differences from long-term average; a "climate coaster" laser-cut from bamboo ply. Initially created as gifts for guests at the 2018 CCI Climate Updates, Geoff Hinchcliffe developed a web app that generates dataforms for over a hundred Australian locations and 25 years, using the Bureau of Meteorology's ACORN-SAT dataset.
The Climate Coaster project has been featured in media including
Create your own coaster with the web app