Tag: visualisation

The Sound of Water: sensing a wetland intervention through interactive environmental audio
Documenting and reflecting on The Sound of Water, with Skye Wassens and Adrian Mackenzie, in Cultural Geographies
Making with Climate Data: Materiality, Metaphor and Engagement
Reflections on the Climate Coaster project, with Geoff Hinchcliffe, in Ian Gwilt (ed), Making Data: Materializing Digital Information (Bloomsbury, 2022).
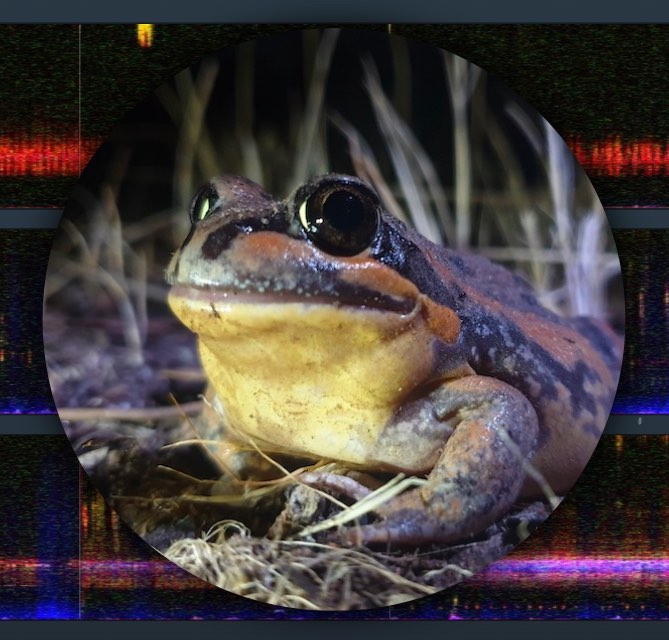
The Sound of Water
An audiovisual data-story exploring Nap Nap Swamp, on the Murrumbidgee River. Created for the Commonwealth Environmental Water Office's Flow-MER program, in collaboration with ecologist Skye Wassens.
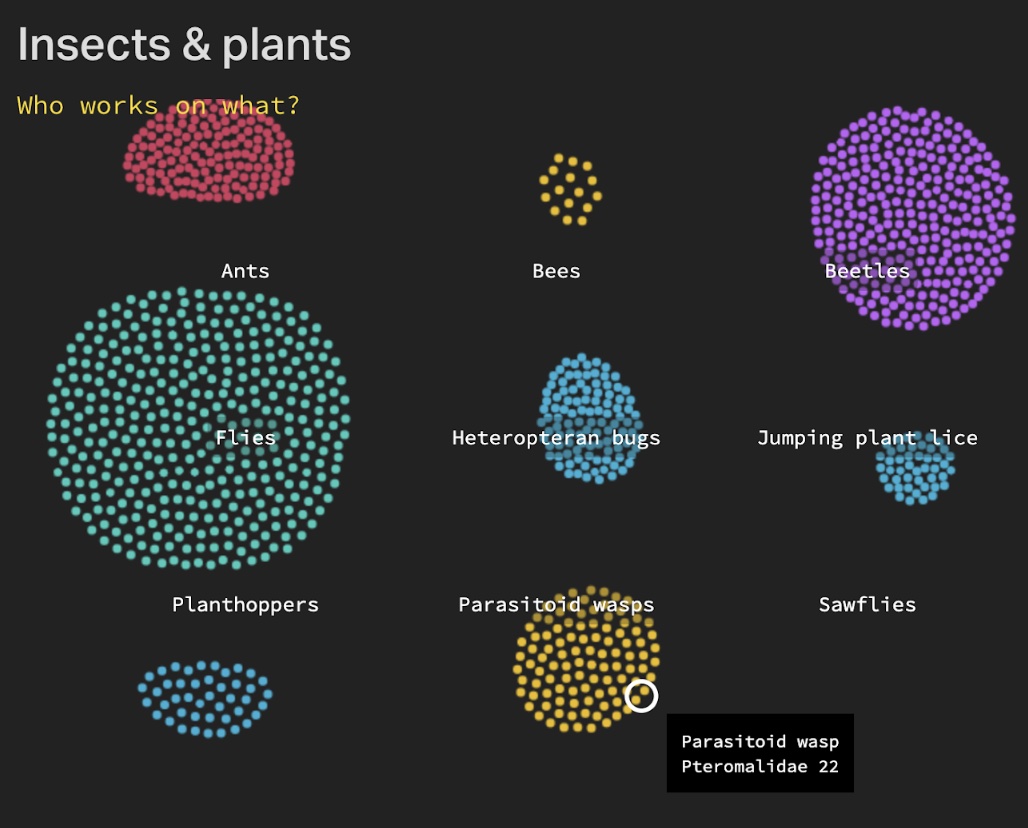
Biodiversity data as public environmental media
with Belinda Smaill, in the Journal of Environmental Media 2(1). An ecocritical analysis of the visual languages of digital biodiversity.
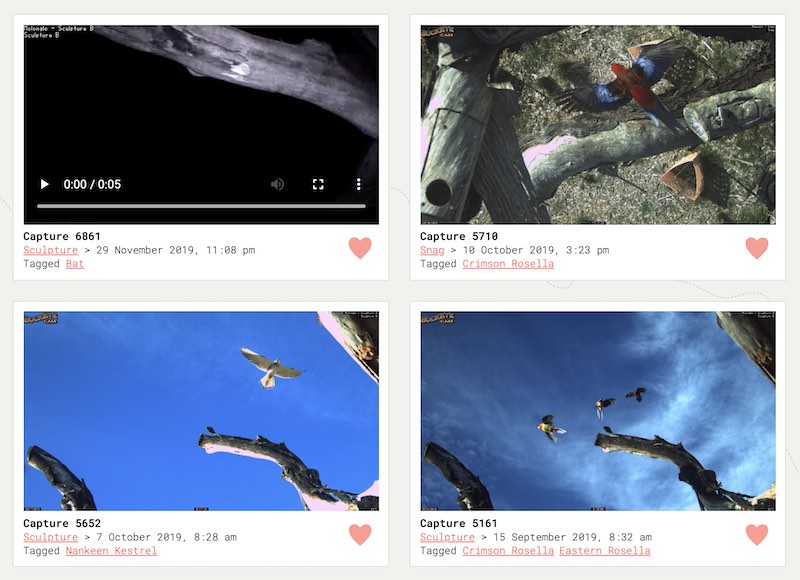
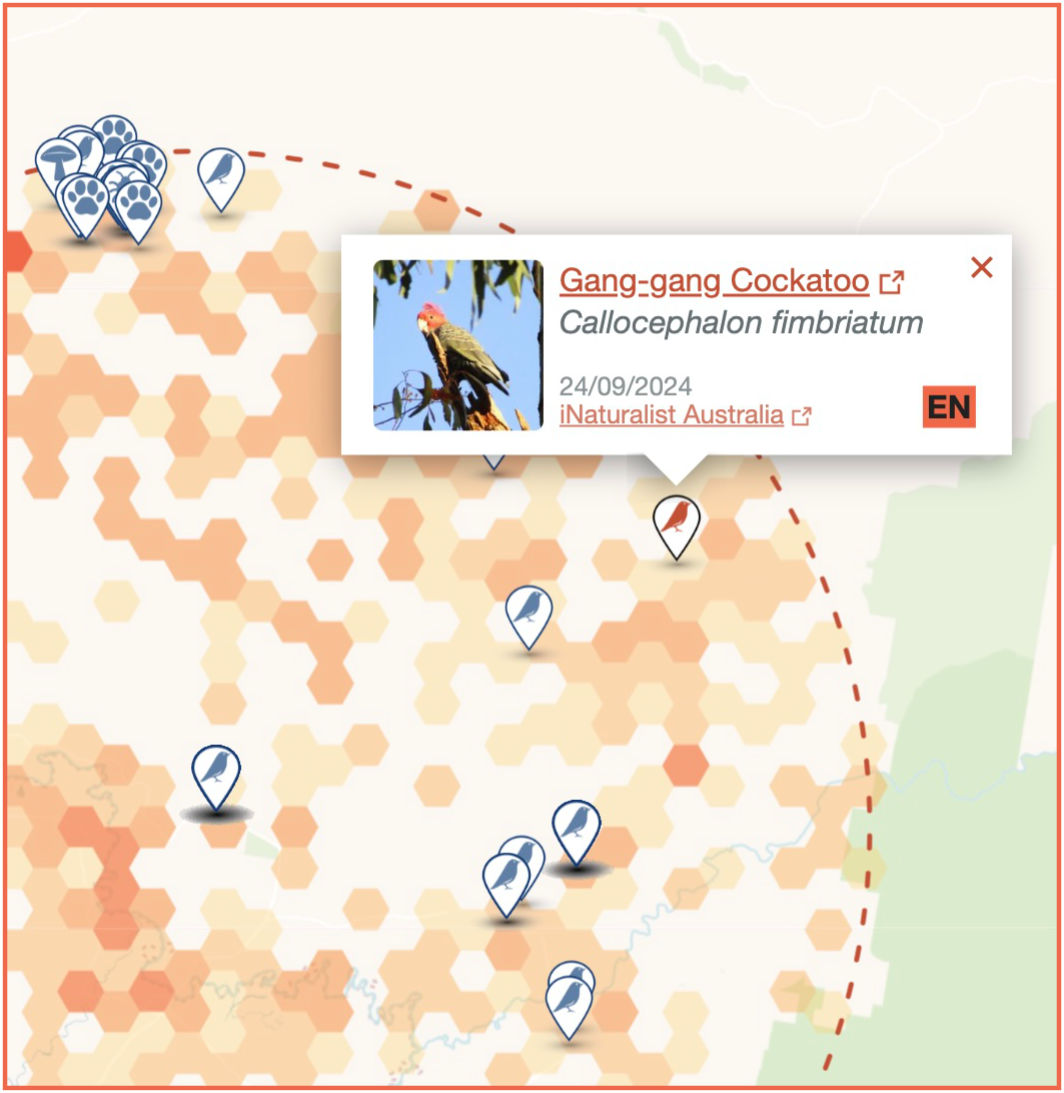
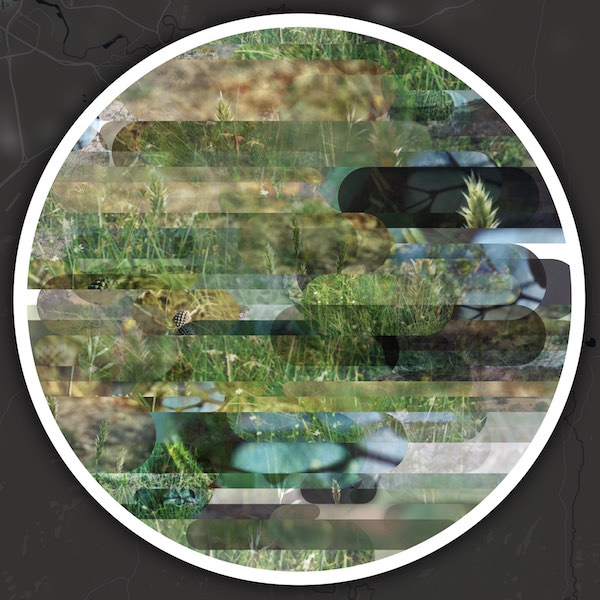
Molonglo Life
A platform for digital encounters with wildlife in the Molonglo River Reserve, on the fringes of urban Canberra.
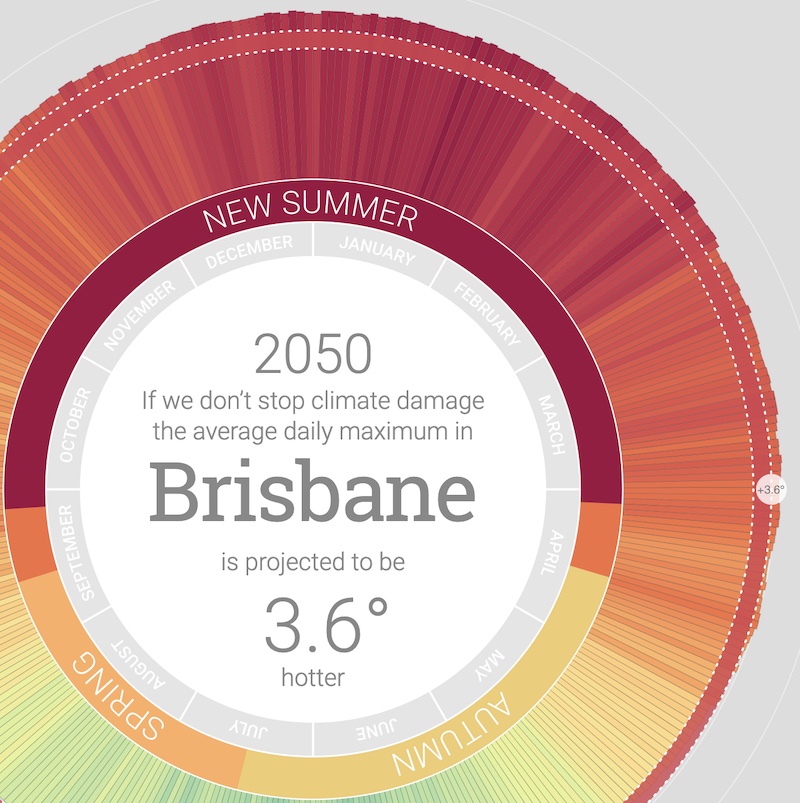
My Climate 2050
Visualising climate change projections for over 4700 locations around Australia. With Geoff Hinchcliffe; commissioned by the Australian Conservation Foundation.
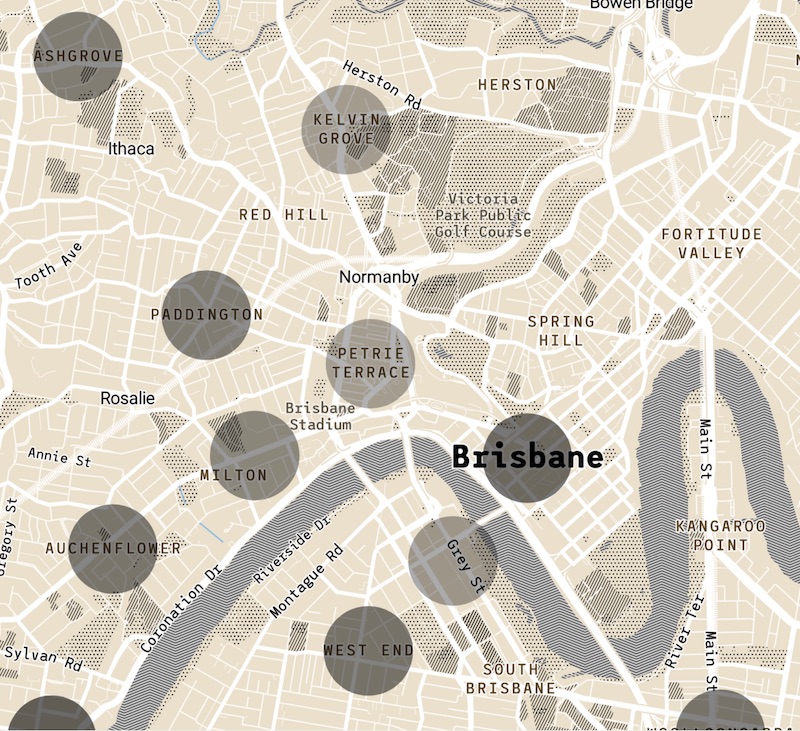
Corley Explorer
An explorer for the State Library of Queensland's Corley Collection; 61,000 photographs of Queensland houses from the 1960s and 70s. Commissioned by SLQ; made with Geoff Hinchcliffe and our friends at Icelab.
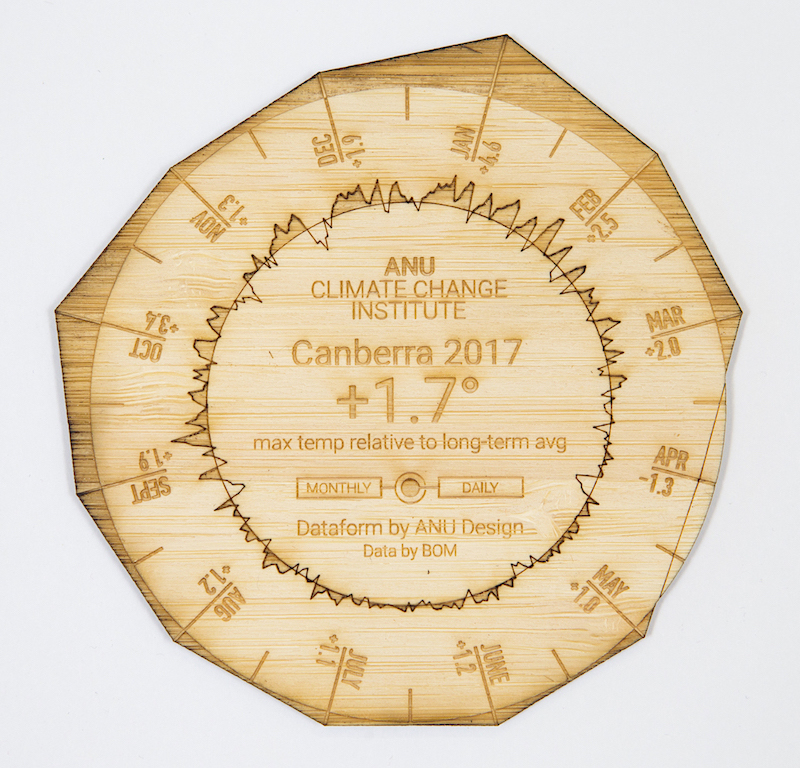
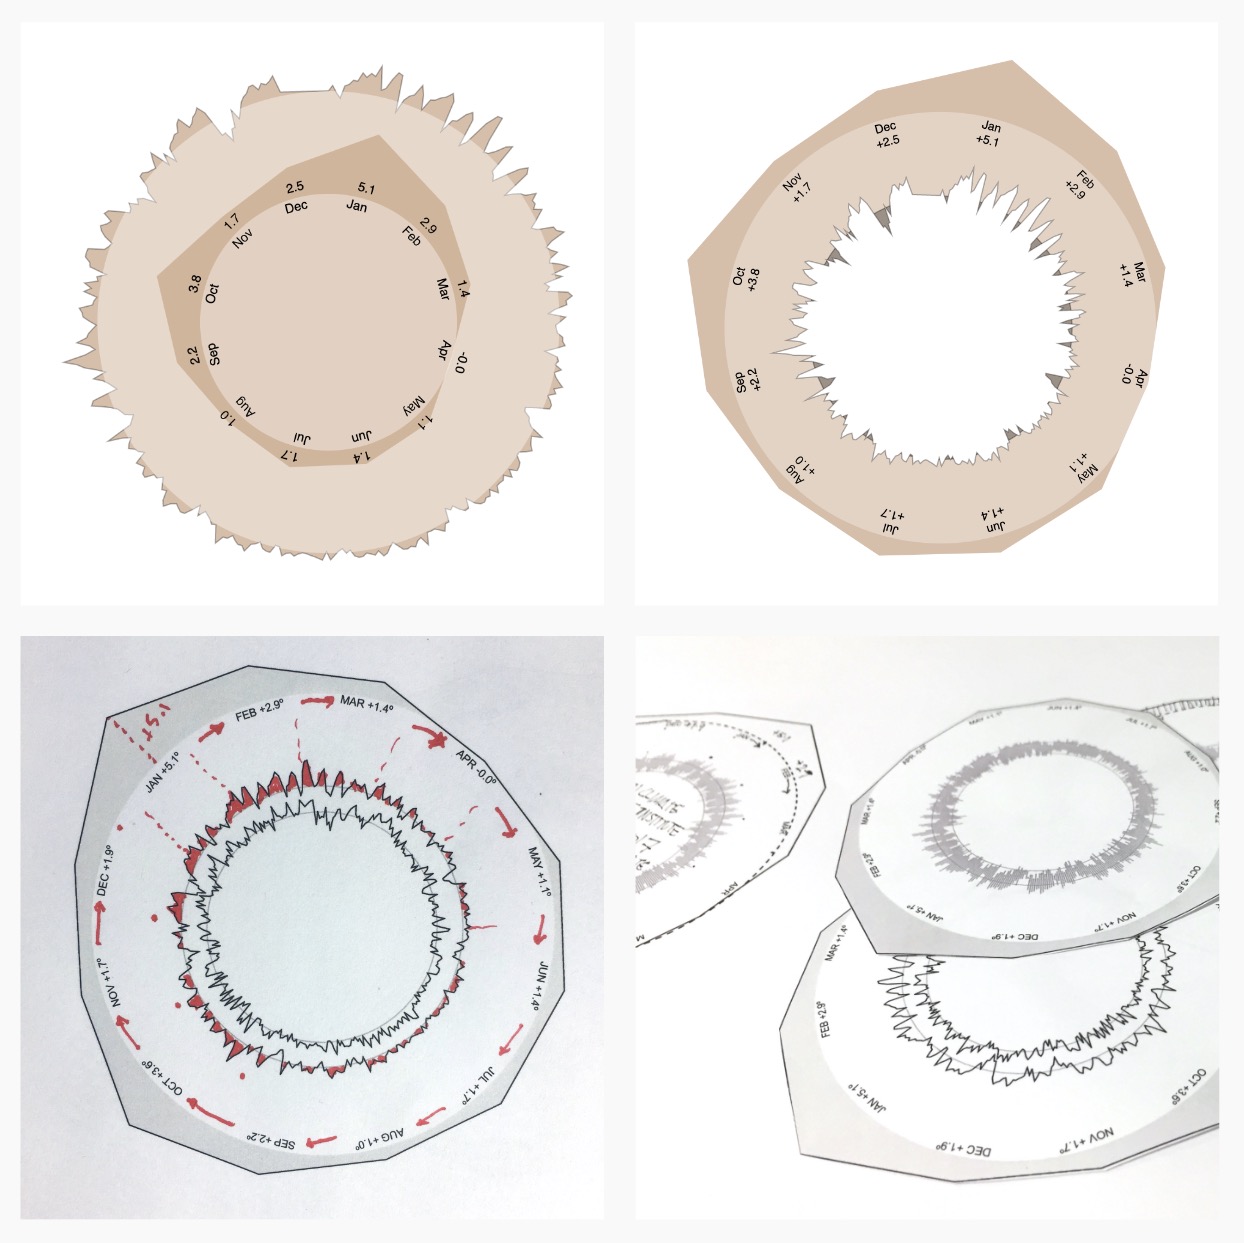
Climate Coasters
Tangible visualisations of Australian climate change, developed with Geoff Hinchcliffe and the ANU Climate Change Institute.
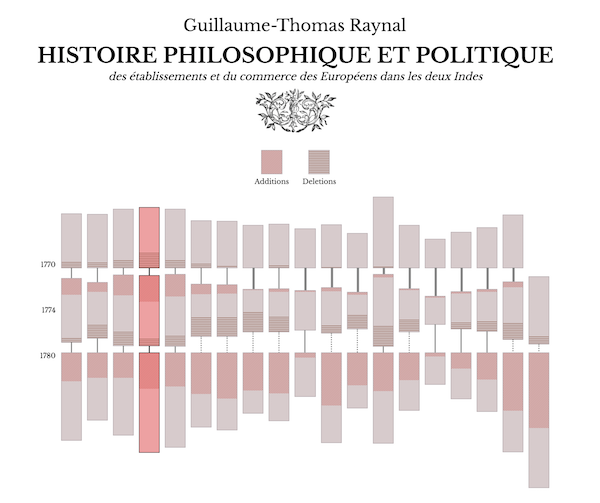
Visualising Raynal
Visualising changes through three editions of Raynal's Histoire des deux Indes. With Geoff Hinchcliffe and Glenn Roe.
Australasian data practices: Mining, scraping, mapping, hacking
in Artlink 37:1, Data Visual. A look at data practice in Australia and New Zealand through the work of four prominent creators spanning visualisation, cartography and digital heritage.
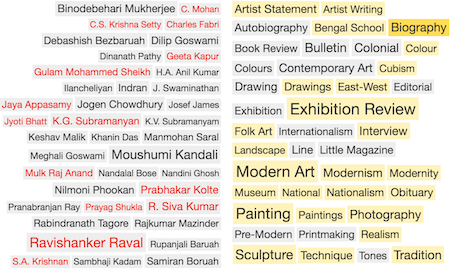
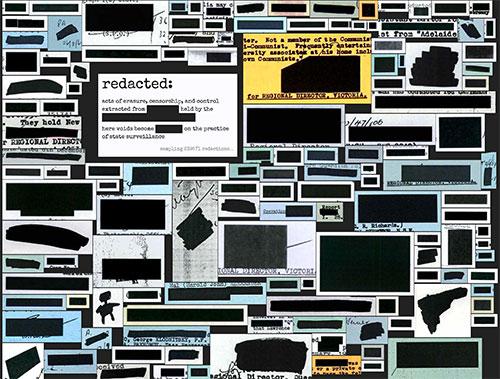
Asia Art Archive Bibliography Interfaces
Generous interfaces for the Asia Art Archive's online bibliography of Indian art
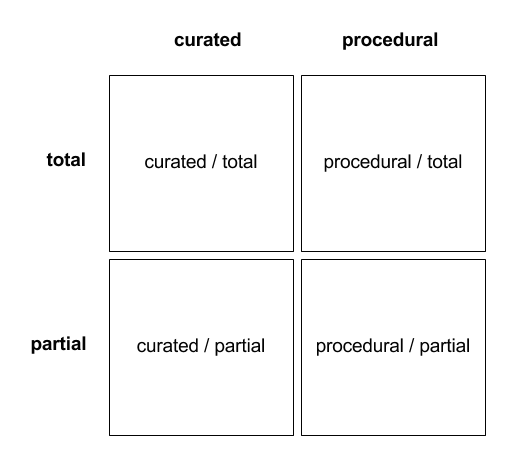
Representing Digital Collections
in Performing Digital: Multiple Perspectives on a Living Archive, ed. David Carlin and Laurene Vaughan (Farnham: Ashgate Publishing, 2015)
The Institutional Harvest
Visualising the history of women's services and agencies in Australia, 1970-2011
Weather Bracelet and Measuring Cup: Case studies in data sculpture
Practice-led research in data sculpture and tangible visualisation.
Playing with Complexity: An Approach to Exploratory Data Visualisation
with Ben Ennis Butler and Sam Hinton, presented at ACUADS 2011
Exploring the Digital Commons: An Approach to the Visualisation of Large Heritage Datasets
with Sam Hinton; presented at EVA 2010
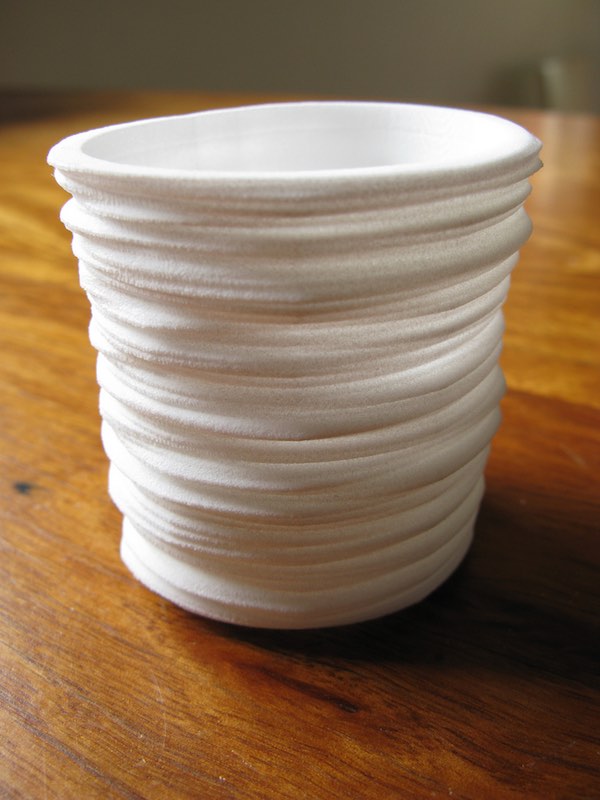
Measuring Cup
Representing long time-series of climate data in small, tangible forms.
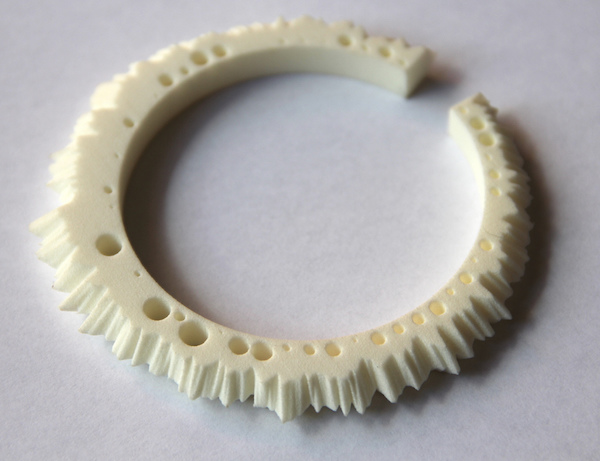
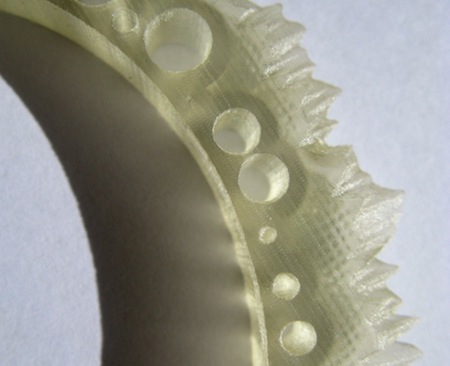
Weather Bracelet
A wearable dataform made from 365 days of Canberra weather
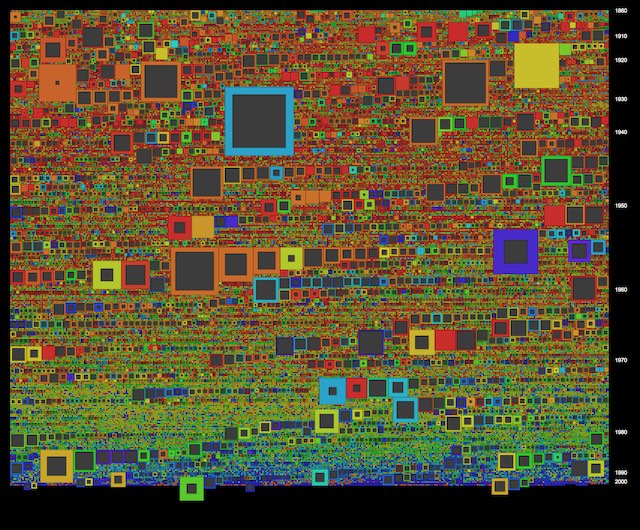
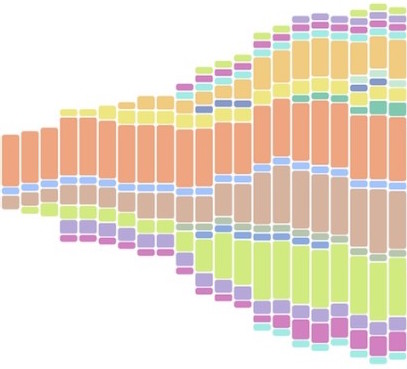
The Visible Archive
A research project on the visualisation of archival collections, supported by the National Archives of Australia.
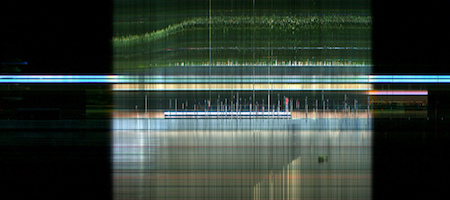
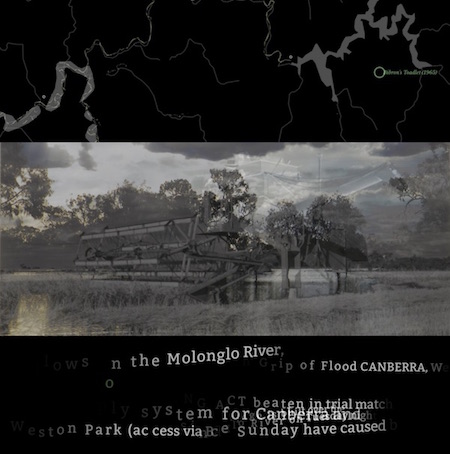
Watching the Street
Slit-scanning the streetscape, revealing patterns of change and stasis in human and environmental activity.
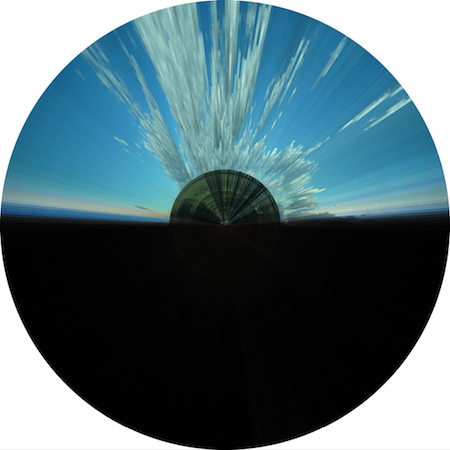
Watching the Sky
Visualising change in the environment, using long image time-series.